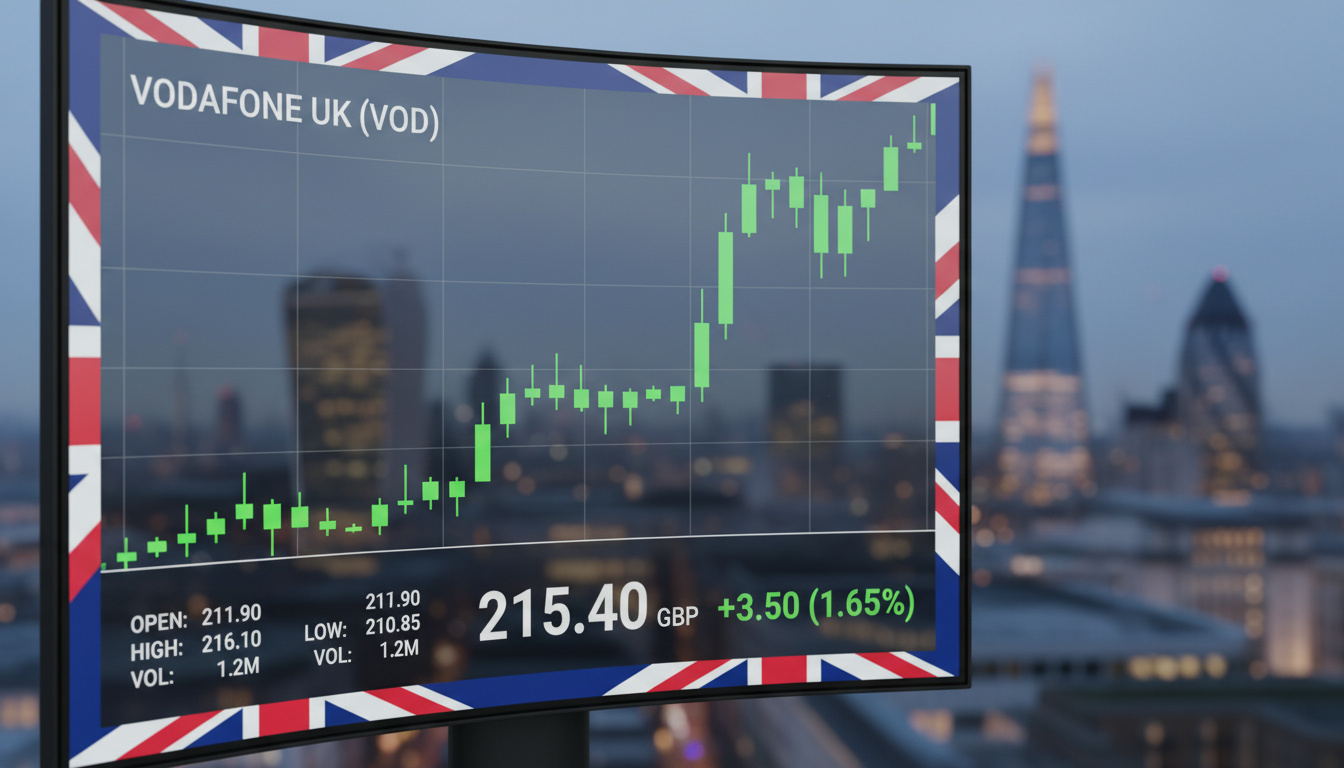
Vodafone Group Plc shares trade at approximately 108.90 to 110.40 GBX on the London Stock Exchange, reflecting mixed short-term sentiment despite a substantial upward trajectory over the past year. The telecommunications giant, listed under ticker LSE:VOD, maintains a market capitalisation of roughly 21.31 billion GBP, positioning it among the UK’s significant large-cap equities.
Recent trading sessions have shown considerable activity, with volumes reaching 53 million shares on March 5, 2026, alongside daily price fluctuations that highlight ongoing investor uncertainty. While the stock has experienced a slight decline of 1.52% in immediate trading, broader metrics reveal a complex financial picture involving significant debt loads, merger activities, and strategic 5G infrastructure investments that continue to influence valuation models.
What is the Current Vodafone Share Price in the UK?
- The stock trades in pence sterling (GBX), not pounds
- Market capitalisation fluctuates between 20.7 and 21.3 billion GBP based on intraday pricing
- Beta of 1.10 indicates slightly higher volatility than the broader FTSE index
- Current valuation represents a 51.45% increase year-over-year
- Trading volume regularly exceeds 40 million shares during active sessions
- The 52-week range demonstrates significant recovery from lows below 65 GBX
- Volatility stands at 4.05%, reflecting telecommunications sector sensitivity
| Metric | Value |
|---|---|
| Market Cap | 21.31 billion GBP |
| P/E Ratio (Forward) | 11.6 |
| Dividend Yield | 4.31% |
| Beta | 1.10 |
| Next Earnings | 11 November 2025 |
| TTM EPS | -0.14 GBP |
| Revenue (FY) | 31.51 billion GBP |
| 52-Week High | 120.90 GBX |
| 52-Week Low | 62.40 GBX |
| Volume (Latest) | 53 million shares |
Live pricing data remains available through official LSE channels and financial data providers throughout UK trading hours.
How Has Vodafone Share Price Performed Recently?
Vodafone exhibits 4.05% volatility with a beta of 1.10, indicating the stock moves approximately 10% more than the overall market. Short-term swings of ±2% within single trading sessions are common, with historical volumes ranging between 41 million and 176 million shares.
The stock has experienced a pronounced upward surge of roughly 71% over the past year as of late February 2026, transforming previous underwhelming performance into notable gains for long-term holders. This recovery occurred despite underlying revenue pressures and significant net losses reported in recent fiscal years.
Recent daily movements have oscillated between gains of 1.20% to 3.44% and declines reaching 2.18%, reflecting reactive sentiment to earnings reports and strategic announcements. The 52-week trajectory shows a dramatic climb from lows of 62.40 GBX to testing resistance near 120.90 GBX, establishing a wide trading corridor that continues to attract both institutional and retail interest.
Why Is the Price Moving Daily?
Short-term fluctuations correlate closely with trading volumes that have ranged between 41 million and 176 million shares historically, creating liquidity-driven price volatility. Immediate dips, such as the recent 1.52% retreat to 108.90 GBX, typically respond to quarterly earnings disclosures revealing persistent negative earnings per share (-0.14 GBP TTM) and net losses of 3.51 billion GBP.
Historical Context
Weekly gains of 2.49% and monthly advances of 4.68% contrast sharply with the longer-term volatility that previously pushed shares toward 80 GBX levels during high-volume selling periods. The current beta range of 0.79 to 1.10, as reported by various analytical platforms, suggests moderate market sensitivity that intensifies during telecommunications sector rotations. Live LSE:VOD data tracks these movements throughout UK trading hours.
What is the Vodafone Dividend and Key Financial Metrics?
The current indicated yield of 4.31% reflects recent distributions of 4.50 GBX for FY 2025, though historical yields reached 11.2% during FY 2024 when share prices traded significantly lower. Forecasts suggest payments of 4.24 GBX to 4.34 GBX through 2028.
Vodafone maintains an attractive dividend profile with an indicated yield of 4.31%, supported by recent distributions including the 4.50 GBX payment for fiscal year 2025 that translated to approximately 5.4% yield at prevailing prices. This income potential persists despite underlying earnings challenges, with historical yields having reached 11.2% in FY 2024 during periods of depressed share valuations.
Market Capitalisation and Structure
The company commands a market capitalisation of 21.31 billion GBP based on approximately 23.87 billion shares issued, with a free float of 18.29 billion shares. Alternative market data snapshots occasionally cite slightly lower valuations around 20.745 billion GBP, reflecting intraday price variations and differing calculation methodologies across LSE official channels and third-party aggregators.
Earnings Timeline and Projections
The next significant catalyst arrives on November 11, 2025, when Vodafone reports H1 2025 earnings with consensus estimates projecting earnings per share of 0.04 GBP, representing improvement from previous negative readings. Forward-looking forecasts anticipate revenue climbing to 40.39 billion GBP by March 2026, with pre-tax profits potentially reaching 4.36 billion GBP, though these projections carry uncertainty given the company’s recent history of 3.51 billion GBP net losses on 31.51 billion GBP revenue. Official filings are available through Vodafone Investor Relations.
Is Vodafone a Good Buy? Forecasts and Analyst Views
Current price targets span from 59.95 GBX to 140.07 GBX, representing potential downside of 45% or upside of 28% from current levels. Three analysts maintain strong buy recommendations, though wide dispersion indicates significant uncertainty about future performance.
Investment considerations centre on a dichotomy between attractive income generation and underlying operational challenges. Analysts have established a maximum price target of 140.07 GBX, suggesting 28% upside potential from current trading levels around 109 to 110 GBX, against a concerning minimum target of 59.95 GBX that would represent substantial capital erosion.
Valuation Metrics
The stock trades at forward price-to-earnings ratios between 10.5 and 12.5, with a PEG ratio of 2.3 indicating potential overvaluation relative to growth prospects. Price-to-revenue multiples of 0.5 to 0.6 suggest the market values the company at a discount to sales, potentially appealing to value-oriented investors despite negative trailing twelve-month earnings.
Risk Factors
Primary concerns include the negative TTM EPS of -0.14 GBP, substantial debt burdens visible in cash flow statements, and revenue growth forecasting challenges with projections showing -5.1% declines counterbalanced by occasional positive momentum. The analyst consensus acknowledges these headwinds while noting the 71% yearly price appreciation that has reshaped risk-reward calculations.
Timeline of Recent Price Events and Milestones
- : Shares bottom at 62.40 GBX, representing the 52-week low amid revenue decline concerns. Source: TradingView historical data
- : Scheduled H1 2025 earnings release with EPS estimates of 0.04 GBP. Source: Investegate.co.uk
- : Analysis confirms 71% year-over-year price appreciation achieved. Source: Digital Look research
- : Stock closes at 109.80-110.40 GBX with 53 million share volume. Source: London Stock Exchange
- : Price tests 120.90 GBX resistance during 52-week high period before retreating to current levels. Source: Investing.com
What is Established and What Remains Uncertain?
| Established Facts | Uncertain Projections |
|---|---|
| Current LSE:VOD price: 108.90-110.40 GBX | Whether shares will reach analyst maximum target of 140.07 GBX |
| Market cap: 21.31 billion GBP (±0.5bn variance) | Exact timing of sustained profitability given -3.51bn GBP net income |
| Dividend yield: 4.31% indicated based on recent distributions | Future yield sustainability if EPS remains negative |
| Next earnings date: November 11, 2025 | Whether FY 2026 forecasts of 40.39bn GBP revenue will materialise |
| Historical 71% yearly gain as of Feb 2026 | Impact of pending merger activities and 5G rollout costs |
Vodafone’s Position in the UK Market Context
Vodafone Group Plc operates as one of the United Kingdom’s primary telecommunications providers, competing within a concentrated market that includes BT Group and other major carriers. The company’s infrastructure investments in 5G networks and strategic merger activities continue to shape its operational trajectory, influencing investor sentiment alongside traditional financial metrics. Unlike purely domestic utilities, Vodafone maintains significant international operations that complicate straightforward valuation comparisons with UK-centric peers.
The stock’s performance reflects broader sector rotations within the FTSE indices, where telecommunications often serve as both defensive income plays and growth-dependent technology holdings. Current trading patterns suggest investors are weighing the company’s 4.31% yield against competitive pressures and capital expenditure requirements necessary for maintaining network superiority. Those considering the broader entertainment sector might reference our Jurassic Park Movies in Order – Release and Chronological Guide for unrelated cultural context.
Analyst Perspectives and Data Sources
“Vodafone’s share price has risen 71% over the past year, transforming from underwhelming performance amid revenue declines and net losses.”
— Market analysis via Digital Look and TradingView, February 2026
“Short-term dips tie to negative EPS and high debt levels visible in cash flow charts, with volatility standing at 4.05%.”
— Technical analysis based on TradingView volatility metrics
Key Takeaways for Investors
Vodafone shares currently trade around 109 GBX on the London Stock Exchange, offering a 4.31% dividend yield against a backdrop of significant yearly gains and ongoing earnings challenges. While analyst targets suggest potential upside to 140 GBX, the wide range of projections and negative trailing earnings underscore the speculative nature of current valuations. Investors should monitor the November 2025 earnings release for clearer indications of whether projected improvements in EPS and revenue will materialise. Those seeking precise measurements in other contexts might consult our 30 Inches in CM – Exact Conversion and Key Uses resource.
Common Questions
What is Vodafone’s exact ticker symbol on the London Stock Exchange?
Vodafone Group Plc trades under the ticker LSE:VOD on the London Stock Exchange. The stock is priced in pence sterling (GBX) rather than pounds. This identifier appears across all major financial platforms and the official LSE listings.
How often does Vodafone pay dividends?
The company maintains regular semi-annual or quarterly distributions depending on fiscal calendar structure. Recent payments included 4.50 GBX for FY 2025, with forecasts suggesting continued payments of 4.24 GBX to 4.34 GBX through fiscal year 2028 according to Digital Look research.
What is the highest analyst price target for Vodafone?
Analysts have established a maximum price target of 140.07 GBX, representing approximately 28% upside potential from current trading levels around 109 to 110 GBX. However, minimum targets of 59.95 GBX indicate significant downside risk also exists.
Why does Vodafone show negative earnings per share?
Trailing twelve-month EPS stands at -0.14 GBP due to reported net losses of 3.51 billion GBP. Despite generating revenue of 31.51 billion GBP, significant costs, debt servicing, and strategic investments have produced negative bottom-line results recently.
When is the next Vodafone earnings report?
Vodafone will release H1 2025 results on November 11, 2025. Consensus estimates project earnings per share of 0.04 GBP, which would mark improvement from previous negative readings. This date is confirmed through investegate.co.uk and financial data providers.
What is Vodafone’s current dividend yield?
The indicated dividend yield stands at 4.31% based on recent distributions. Historical yields reached 11.2% during FY 2024 when share prices traded lower. Current forecasts suggest yields may stabilize around 4.0% to 4.5% depending on share price performance.
What factors cause Vodafone’s share price volatility?
Price swings correlate with trading volumes between 41 and 176 million shares, quarterly earnings disclosures, and debt levels. The beta of 1.10 indicates the stock moves roughly 10% more than the broader market. Merger activities and 5G infrastructure costs also influence valuations.
How can UK investors buy Vodafone shares?
Investors may purchase shares through UK brokerage platforms, investment apps, or pension wrappers like SIPPs. Shares trade on the London Stock Exchange during standard UK market hours. Financial platforms like Hargreaves Lansdown provide access to LSE:VOD.
Related stories





Marcus Walsh is Politics & Public Affairs Editor, covering Westminster, councils and public policy.